
Tuesday May 26th! MLB!
How to make an MLB line!


While I think there is limited value to creating your own odds, I do think there are reasons to do it. I once thought that this was the “answer” to solving the money line issues that sportsbooks set. I have since found that making your own lines helps with situations, not with betting. My AI and I have accepted the concept that handicapping is 90%-95% of beating the odds. This means that my own odds are only 5%-10% of that value. Sports betting is all about the price. Having your own odds helps determine whether the market is overpriced or underpriced. This specific determination allows you to make better bets; it is helpful to have them.
Odds are implied. One team should win a game at an implied probability percentage. If we were to calculate a 55% implied chance for a team, we could convert that into a money line, which would become -122. If the sportsbook’s odds were to have odds at -145, we could see the market is overpaying. We could then decide to skip this spot as we really don’t want to lose value like that. How do we get to that point?
First, we need to identify the strengths of each team. It can be as simple as looking at the standings and using the win percentage for each team. We will know their respective power in terms of winning games, which is a good place to start. However, we need to be more thorough than that. I use Base Runs standings and model projections. It doesn’t need to be this complex, but that is my process.
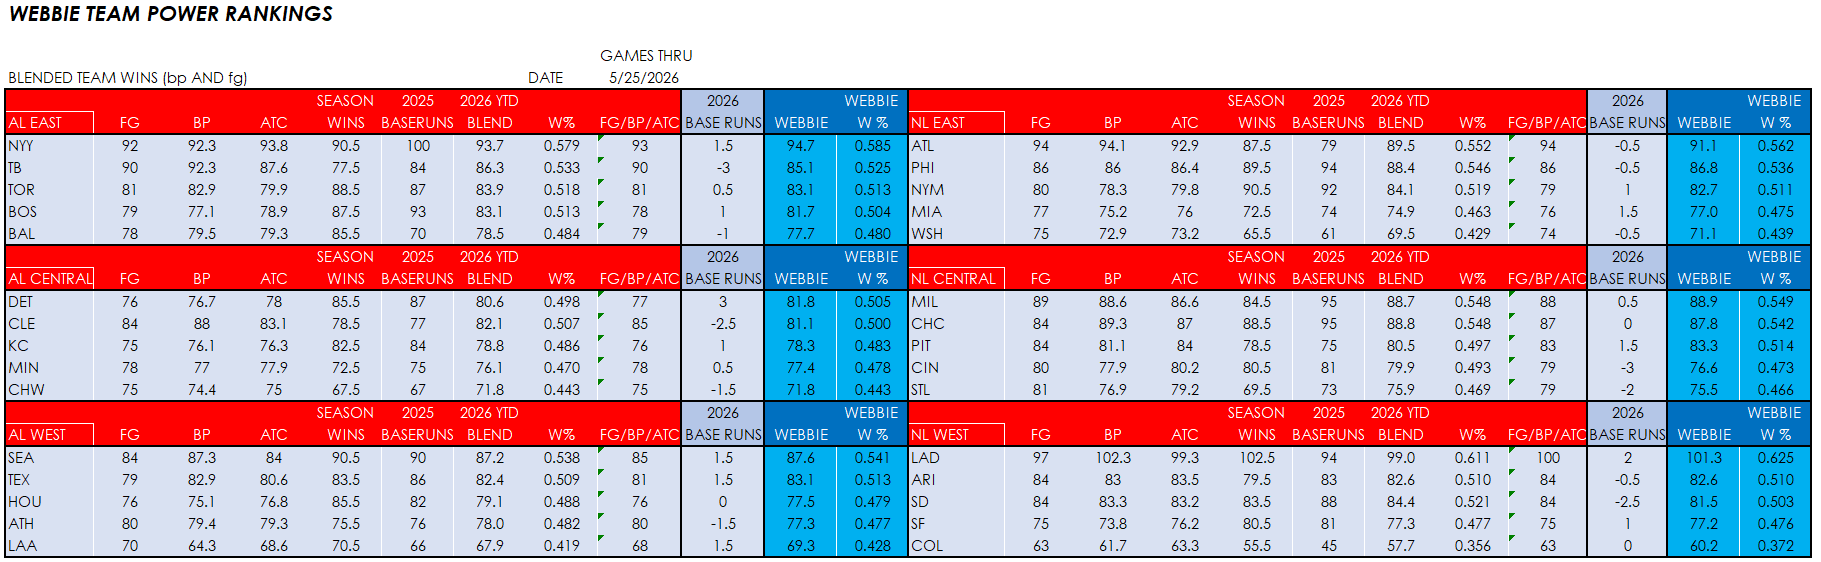
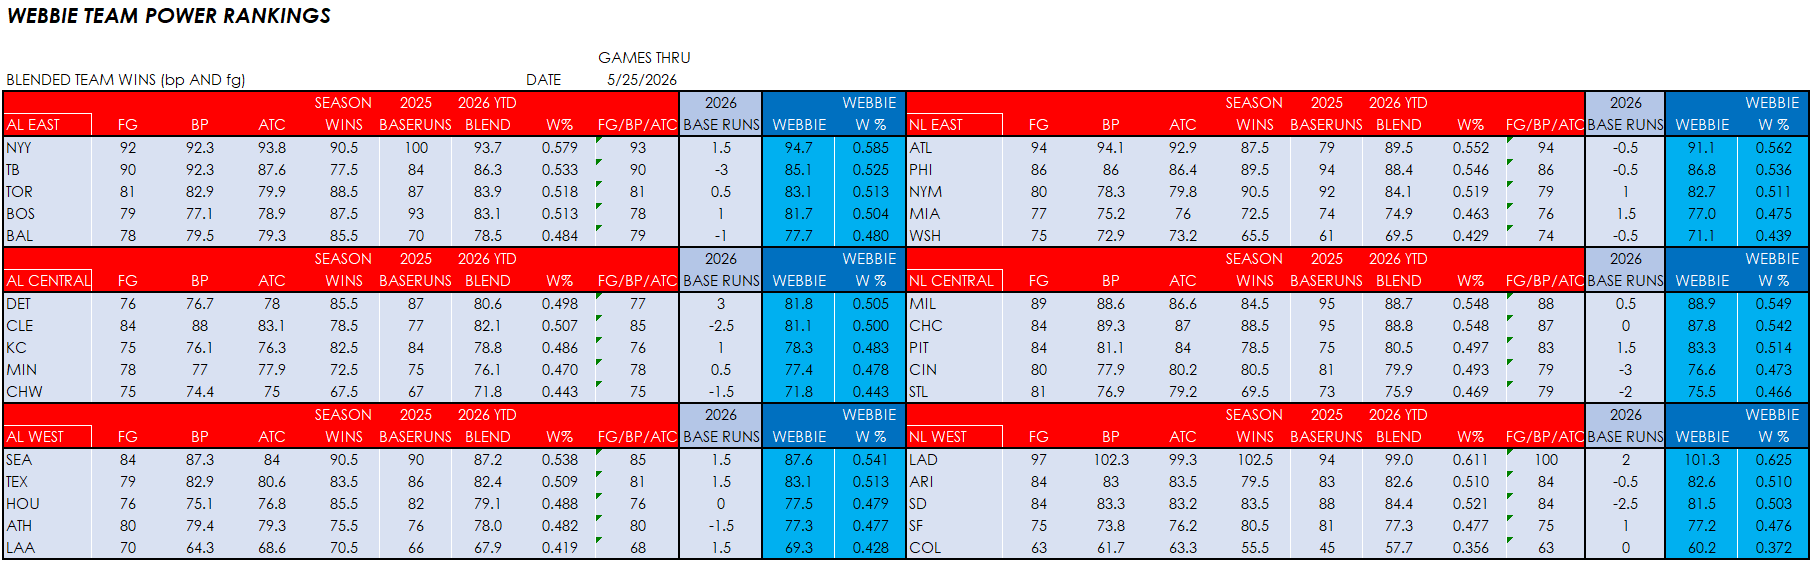
In the above image, my ratings, FG is a model (FanGraphs), BP is a model (Baseball Prospectus), and ATC is a model as well. I have balanced the models with the Vegas Season Win totals to get a market view. I average these together, then subtract or add Base Runs exceptions to get a final power rank shown as a win percentage. These will differ from “real” world current standings quite a bit in some cases. The purpose is to clearly identify the strength of a team, so I look at luck. If a team has been luckier, then Base Runs penalizes them with a munis number of wins. If a team has been unlucky, Base Runs adds wins to overcome their bad luck. By doing this, we get the “true” value of strength or at least as best we can.
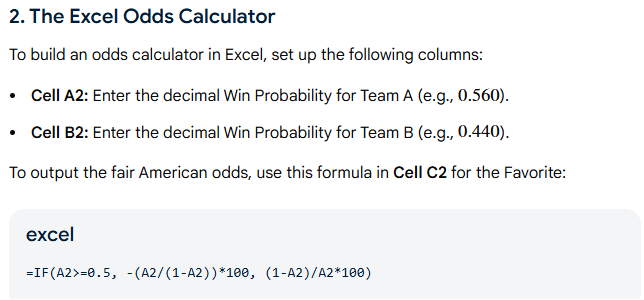
When we have settled on how we are going to provide our strengths, we then start making odds. There is a formula to compare teams’ win percentages. We can determine the probability of a team winning against any other team if we know their win percentages. In the image below is the formula.
I have it set up, so all I have to do is input the data. It looks like this.
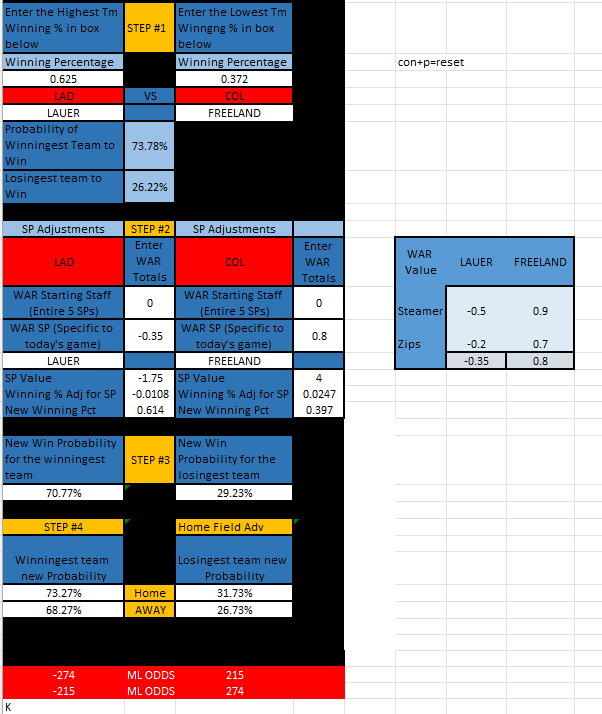
I have to enter each team’s win percent and the pitcher’s name. It will produce the probability for each team winning the game. In the case above, LAD has a 73.78% and COL a 26.22% chance. Now we have to account for the quality of the starting pitchers. I do this via projected WAR totals for each pitcher from Streamer and Zips. These are available on FanGraphs. I input those numbers on the right-hand side to get an average for each pitcher. When I do that, my calculations automatically change the winning percentage for each team. The pitcher averages are in the SP Adjustments section. There are roughly 5 guys that make a rotation, so I multiply the pitch score by 5, thus accounting for this pitcher’s value to his team’s rotation. That calculation will show up in SP Value. Once I have the pitcher’s value, I need to then get it for this one game. I divide the value by 162, and that gives me the winning % adjustment. That adjustment is subtracted or added to the beginning win percentage to now have a pitcher-adapted win percentage. That shows as New Winning Pct on my spreadsheet. Use the same formula as before, and get new win probabilities. You will see that LAD went from 73.78% now down to 70.77% because of the pitchers. The last step is to include a home-field edge. I use 2.5% for the home field or .11 on the money line. Then, at the bottom, I show the winning probabilities for each team with home-field edge and convert those to money lines.
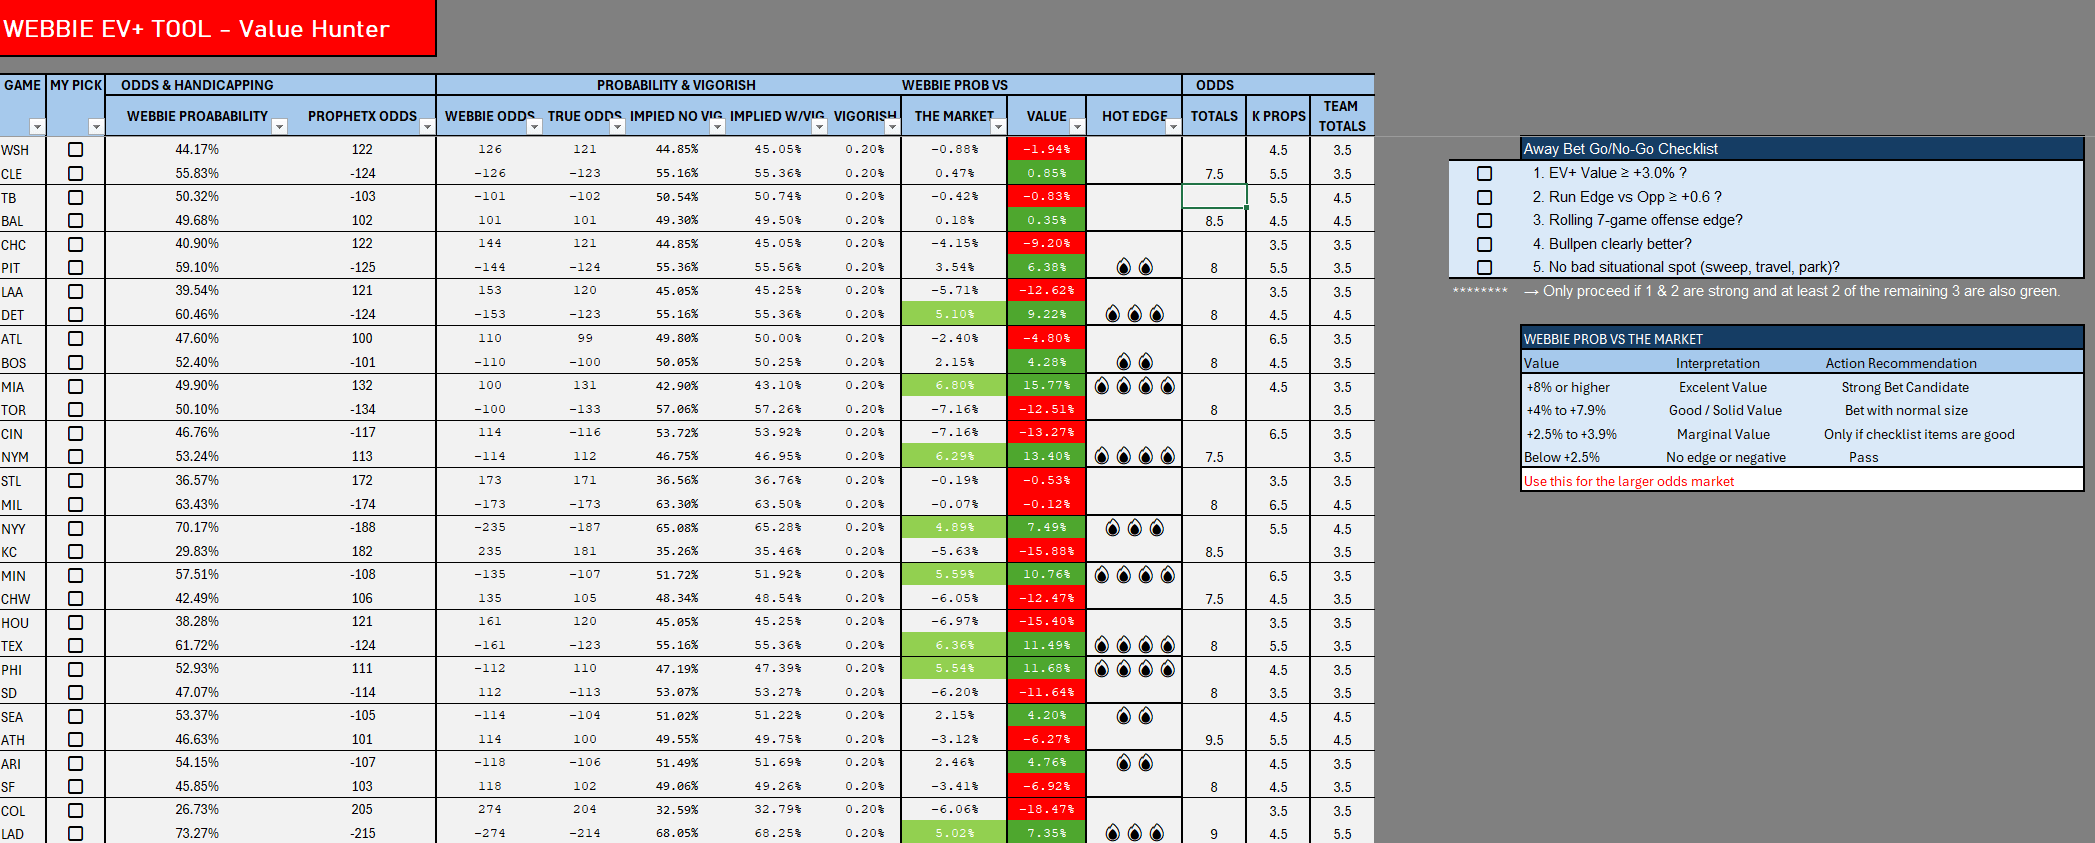
My thought is that there is no nuance for me. I use data-specific information from the winning percentage to the ratings of the pitchers. I believe it provides the truest form of strength in the odds. When you see the Ev Tool, the column “Webbie Probability” is from this process. Webbie Odds column is the probabilities converted into money lines for ease of comparison.
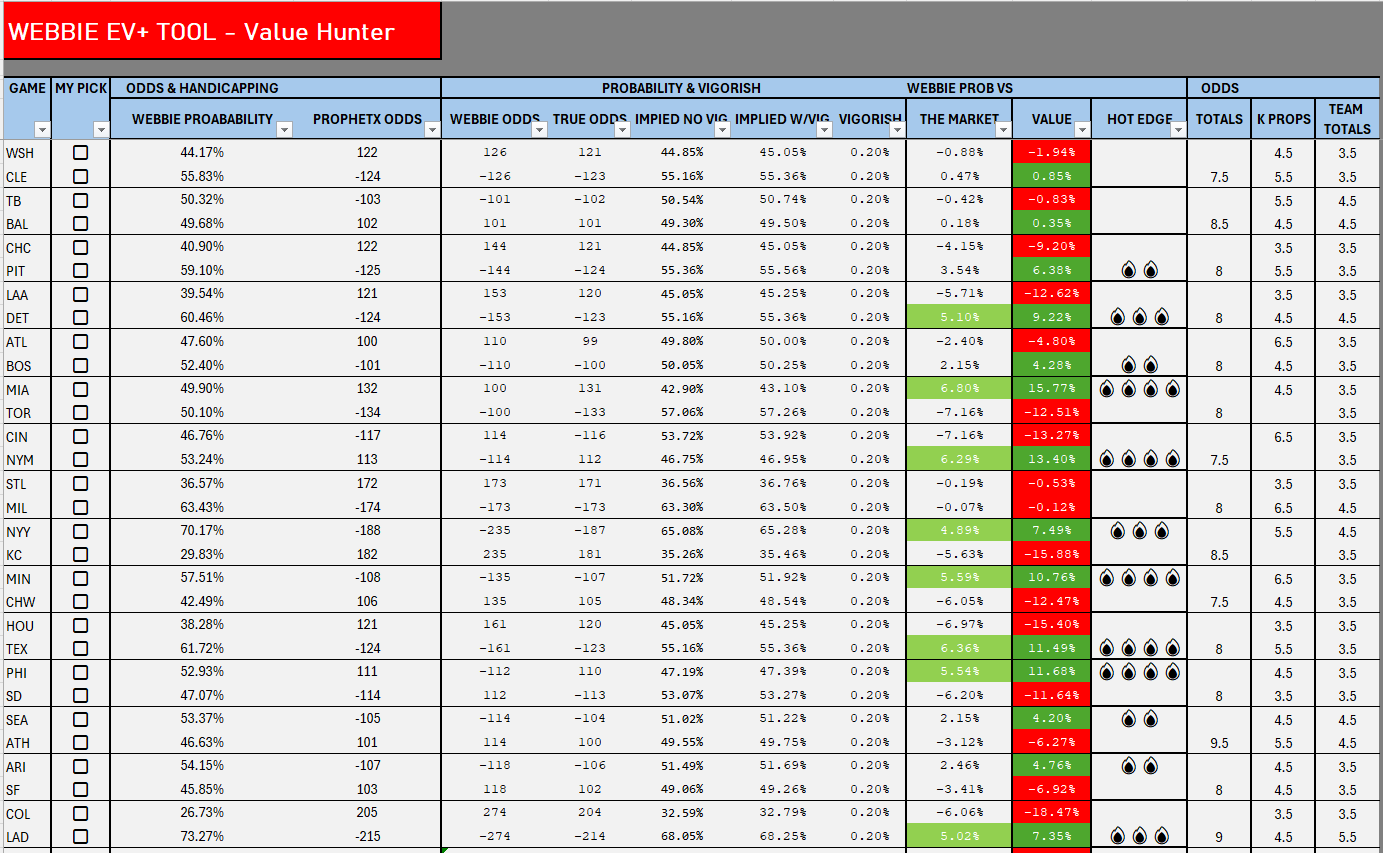
So I know my Webbie Odds are not accurate to a point where just bet the value shown, but that is more sport related that misguided odds. However, I can still look at my odds and probabilities to see what a line should be against what it is to determine if there is a price error. That is mainly how I use my odds. I will, though, make a list of value spots and see what the Matchup Explorer shows. Sometimes I can find value in the price and get a good handicap. Anyway, food for thought.
Today’s Data
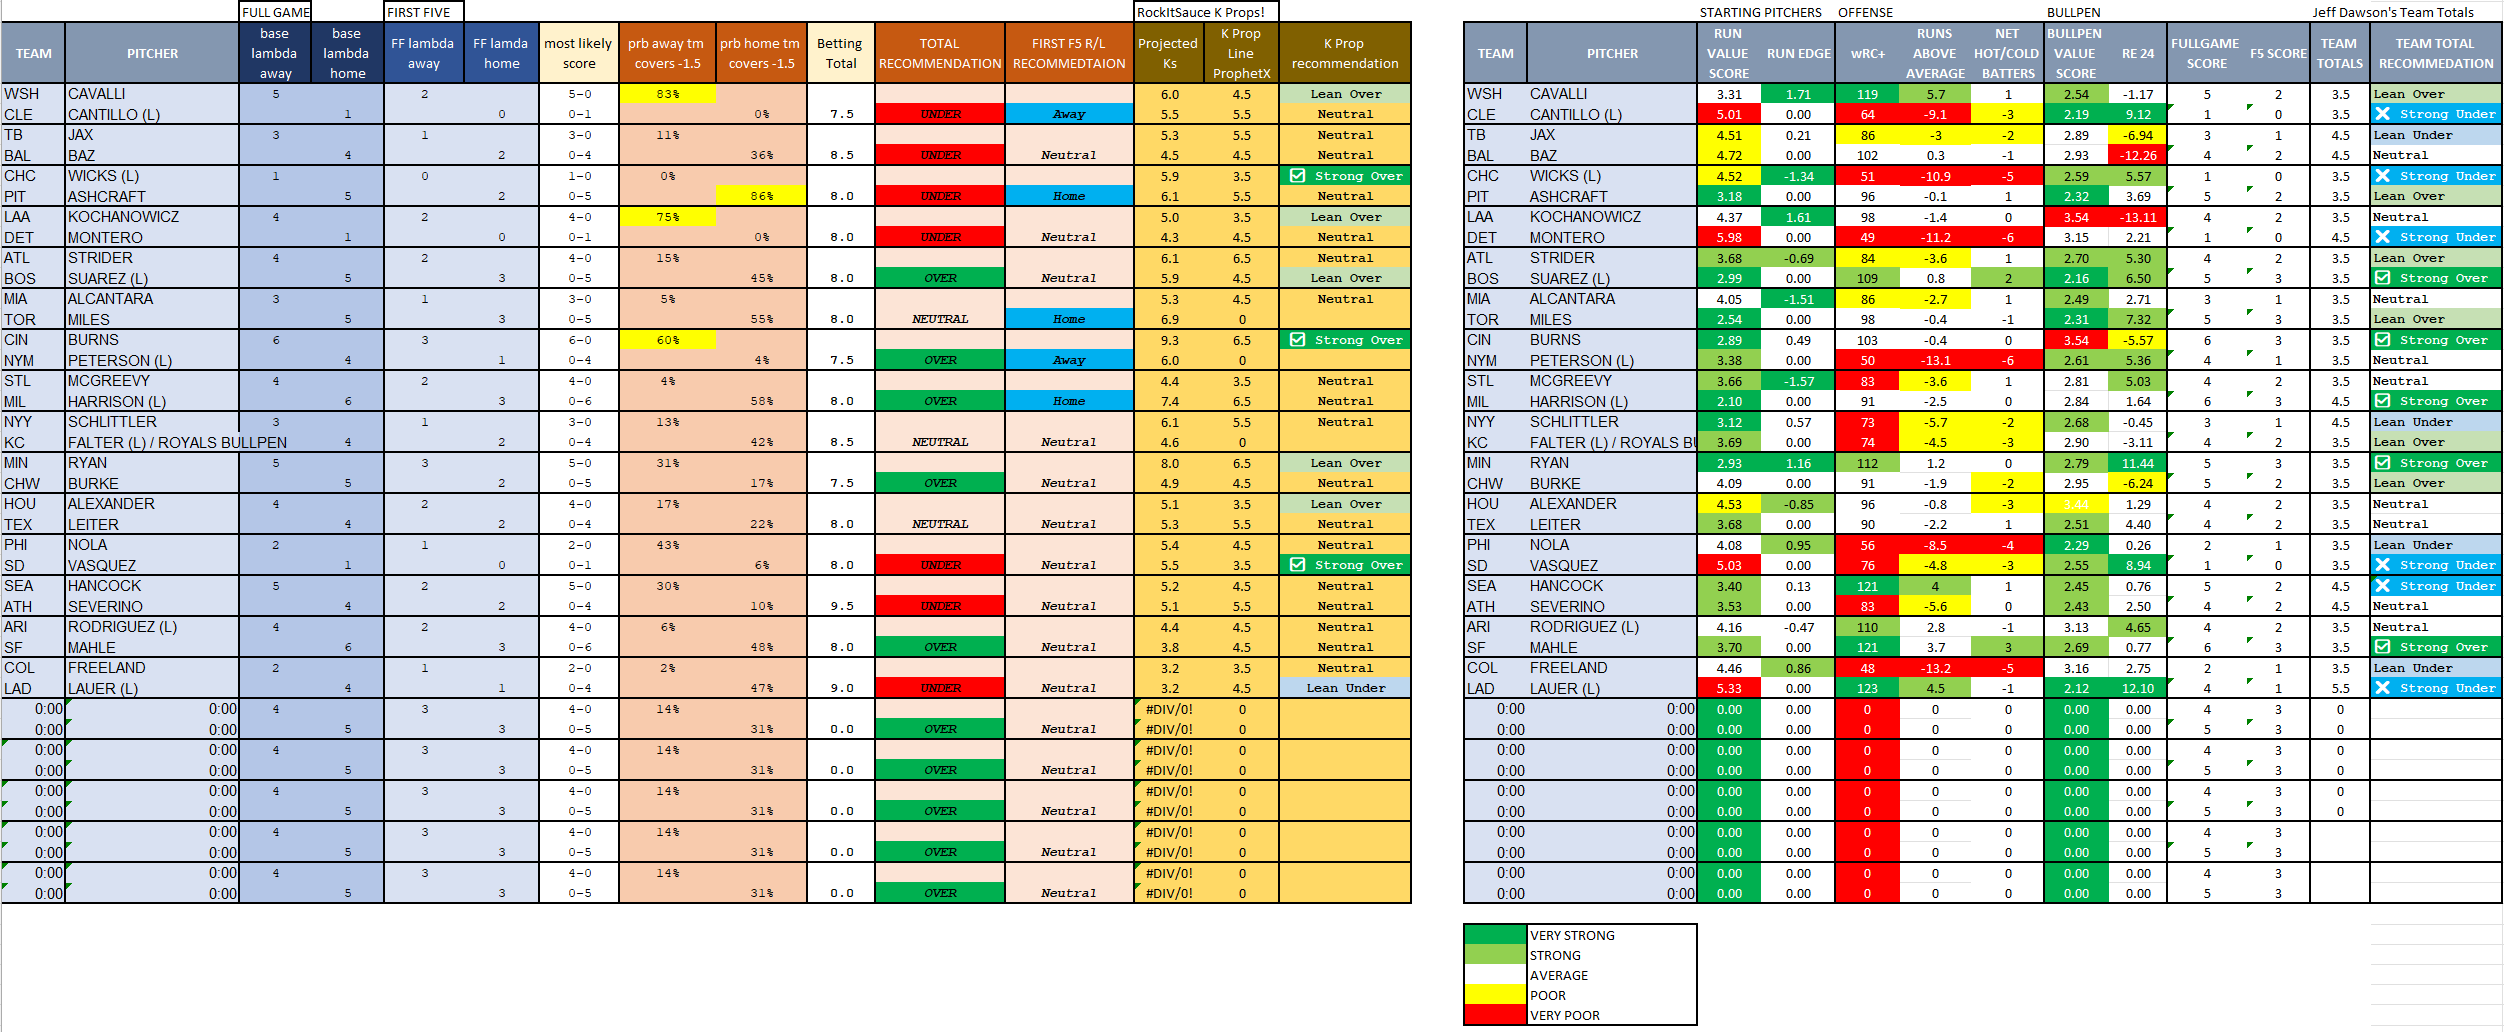
Matchup Explorer
Ev Tool
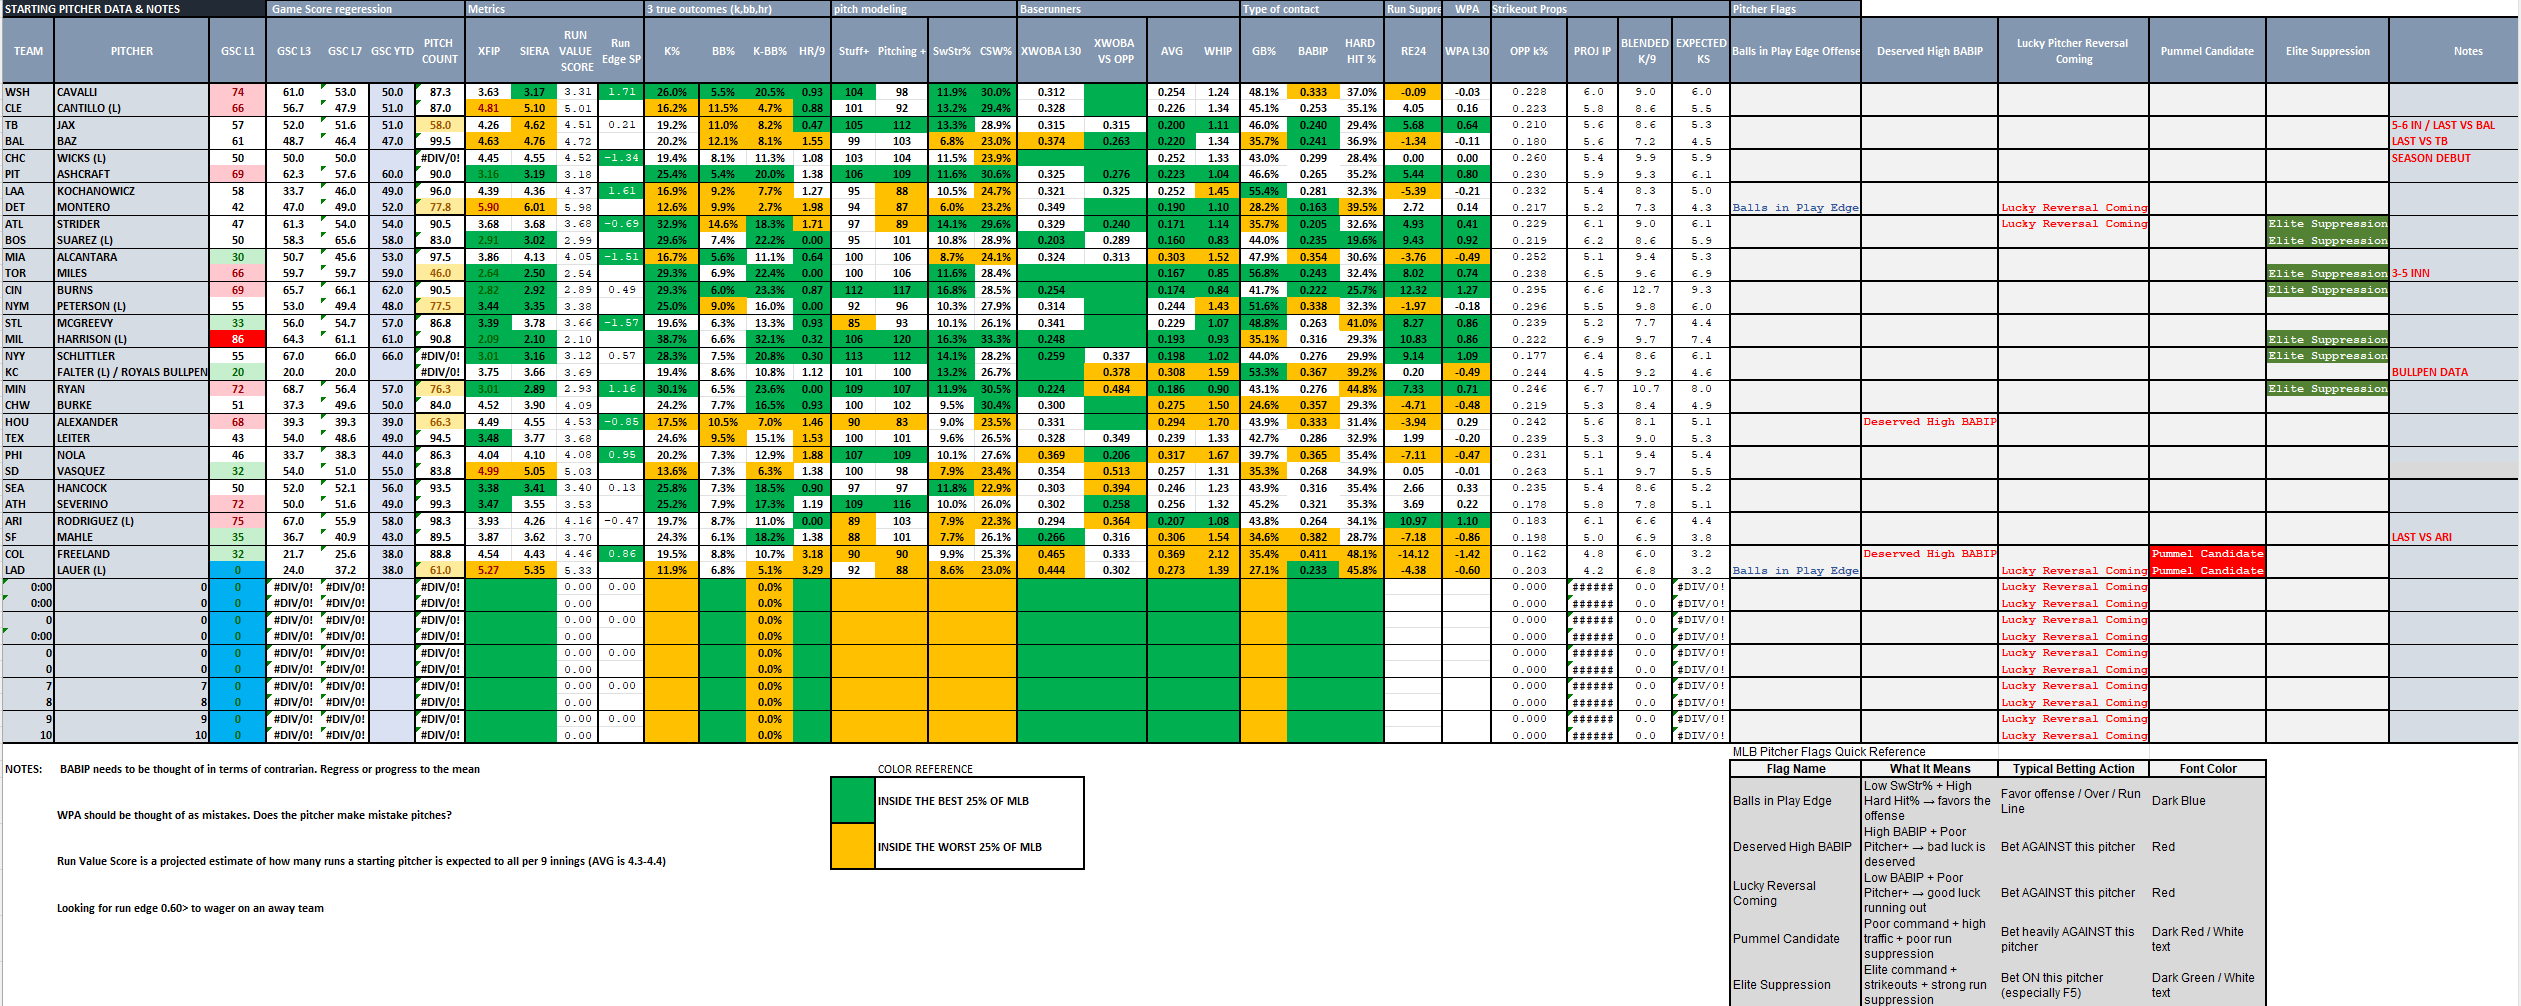
Starting Pitchers
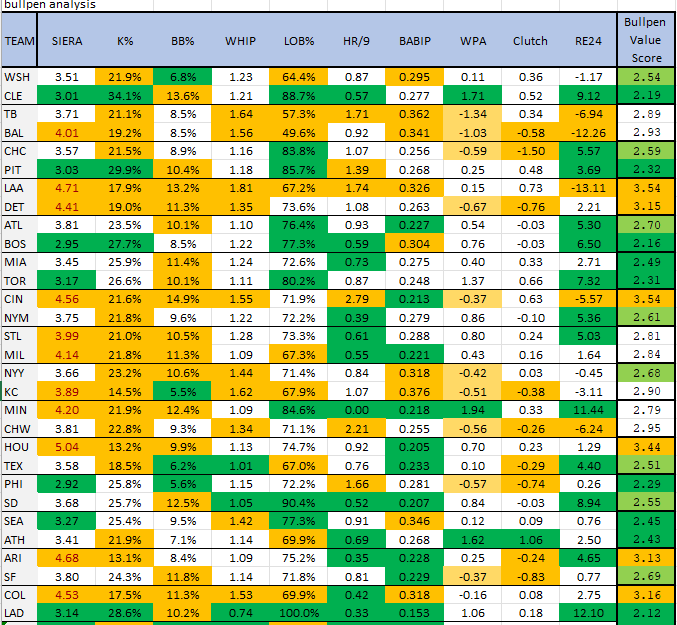
Bullpen Analysis
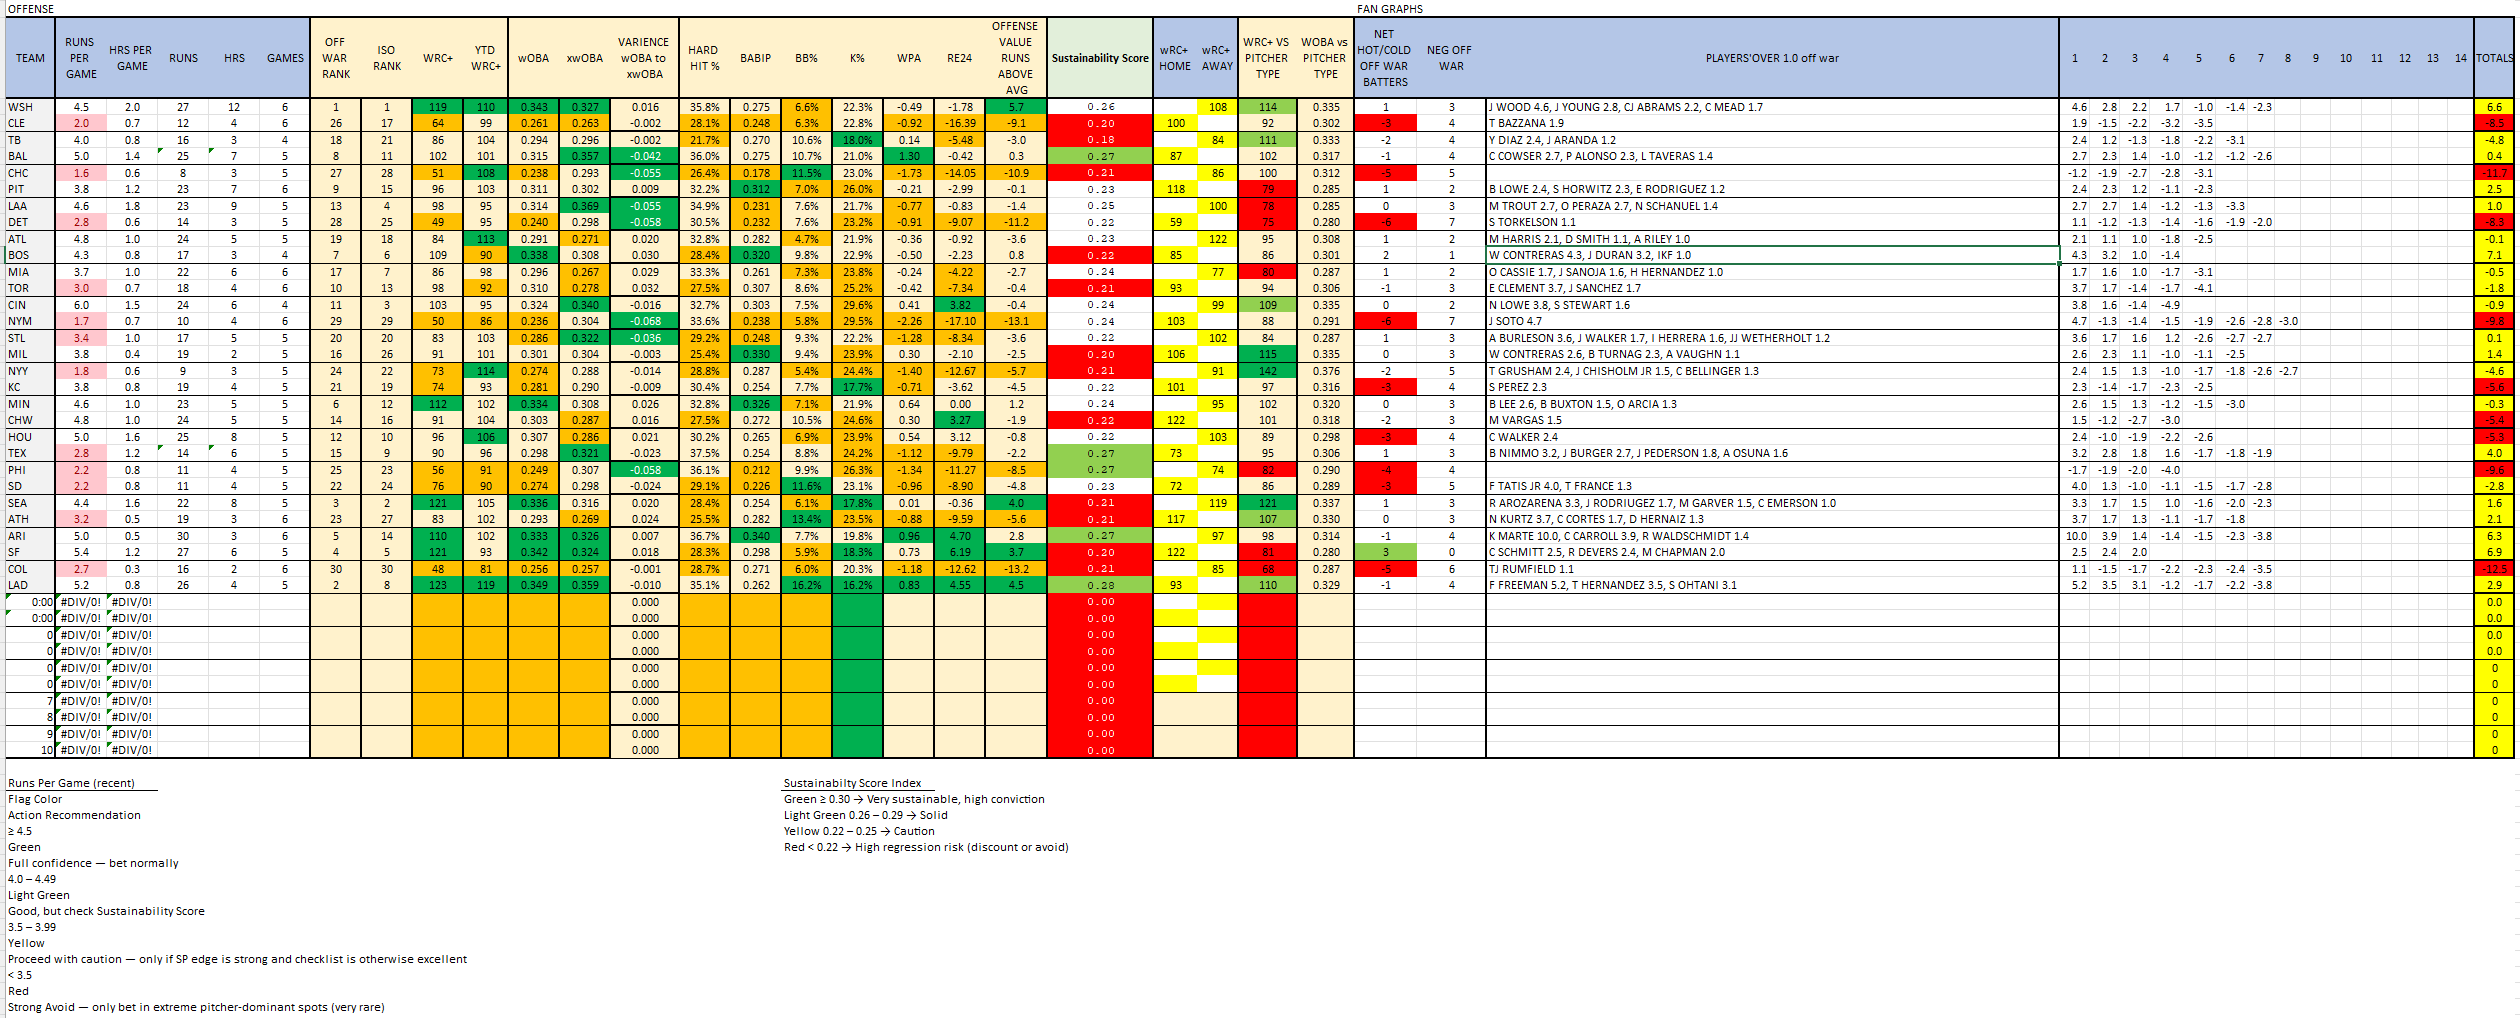
Offense
My Action Today
PIT Aschraft -125
CIN Burns -121
MIN Ryan -108
Good Luck today!
Webbie